How to build an AI visibility report for your clients
Your client has already asked ChatGPT about a business like theirs and didn’t see themselves in the answer. Now they want to know what the agency is going to do about it. The problem is that AI has no ads dashboard and no fixed ranking like traditional search: every answer is written on the spot, and the same question can bring different names from one day to the next.
That doesn’t rule out a good report. It just changes what the report measures and how it tells the story.
What to measure
The right questions, agreed with the client
Everything starts with 5 to 10 questions their customers would actually ask, with the service and the location: “who is the best dentist for implants in Tijuca?”, “aesthetic clinic open on Saturdays in Moema”. Agree on the list with the client and put it in the report. That way nobody argues later about whether it was the right question, and the measurement is about their business, not a generic keyword.
Frequency, not one day’s position
Ask each question more than once, in each AI, and count how many answers included the client: “showed up in 7 of 24 answers”. That “X of Y” is honest, reads in one line and doesn’t depend on the luck of a single search. Average position is a detail, not the headline.
By AI
ChatGPT, Gemini, Google’s AI Mode and AI Overviews answer in different ways and read different sources. It’s common for a client to do well in one and badly in another. Splitting by AI shows where the problem is and keeps an average from hiding everything.
Who shows up instead of them
The names that come up when the client doesn’t are the most useful part of the report. Next to each one, what the AI says about them (“takes insurance”, “over 300 reviews”) and the sites it cites. That’s where the month’s tasks come from.
The details the AI gets wrong
An old address, a phone nobody answers, the wrong specialty. This is the finding clients value most, because it’s concrete and quick to fix.
How to show it
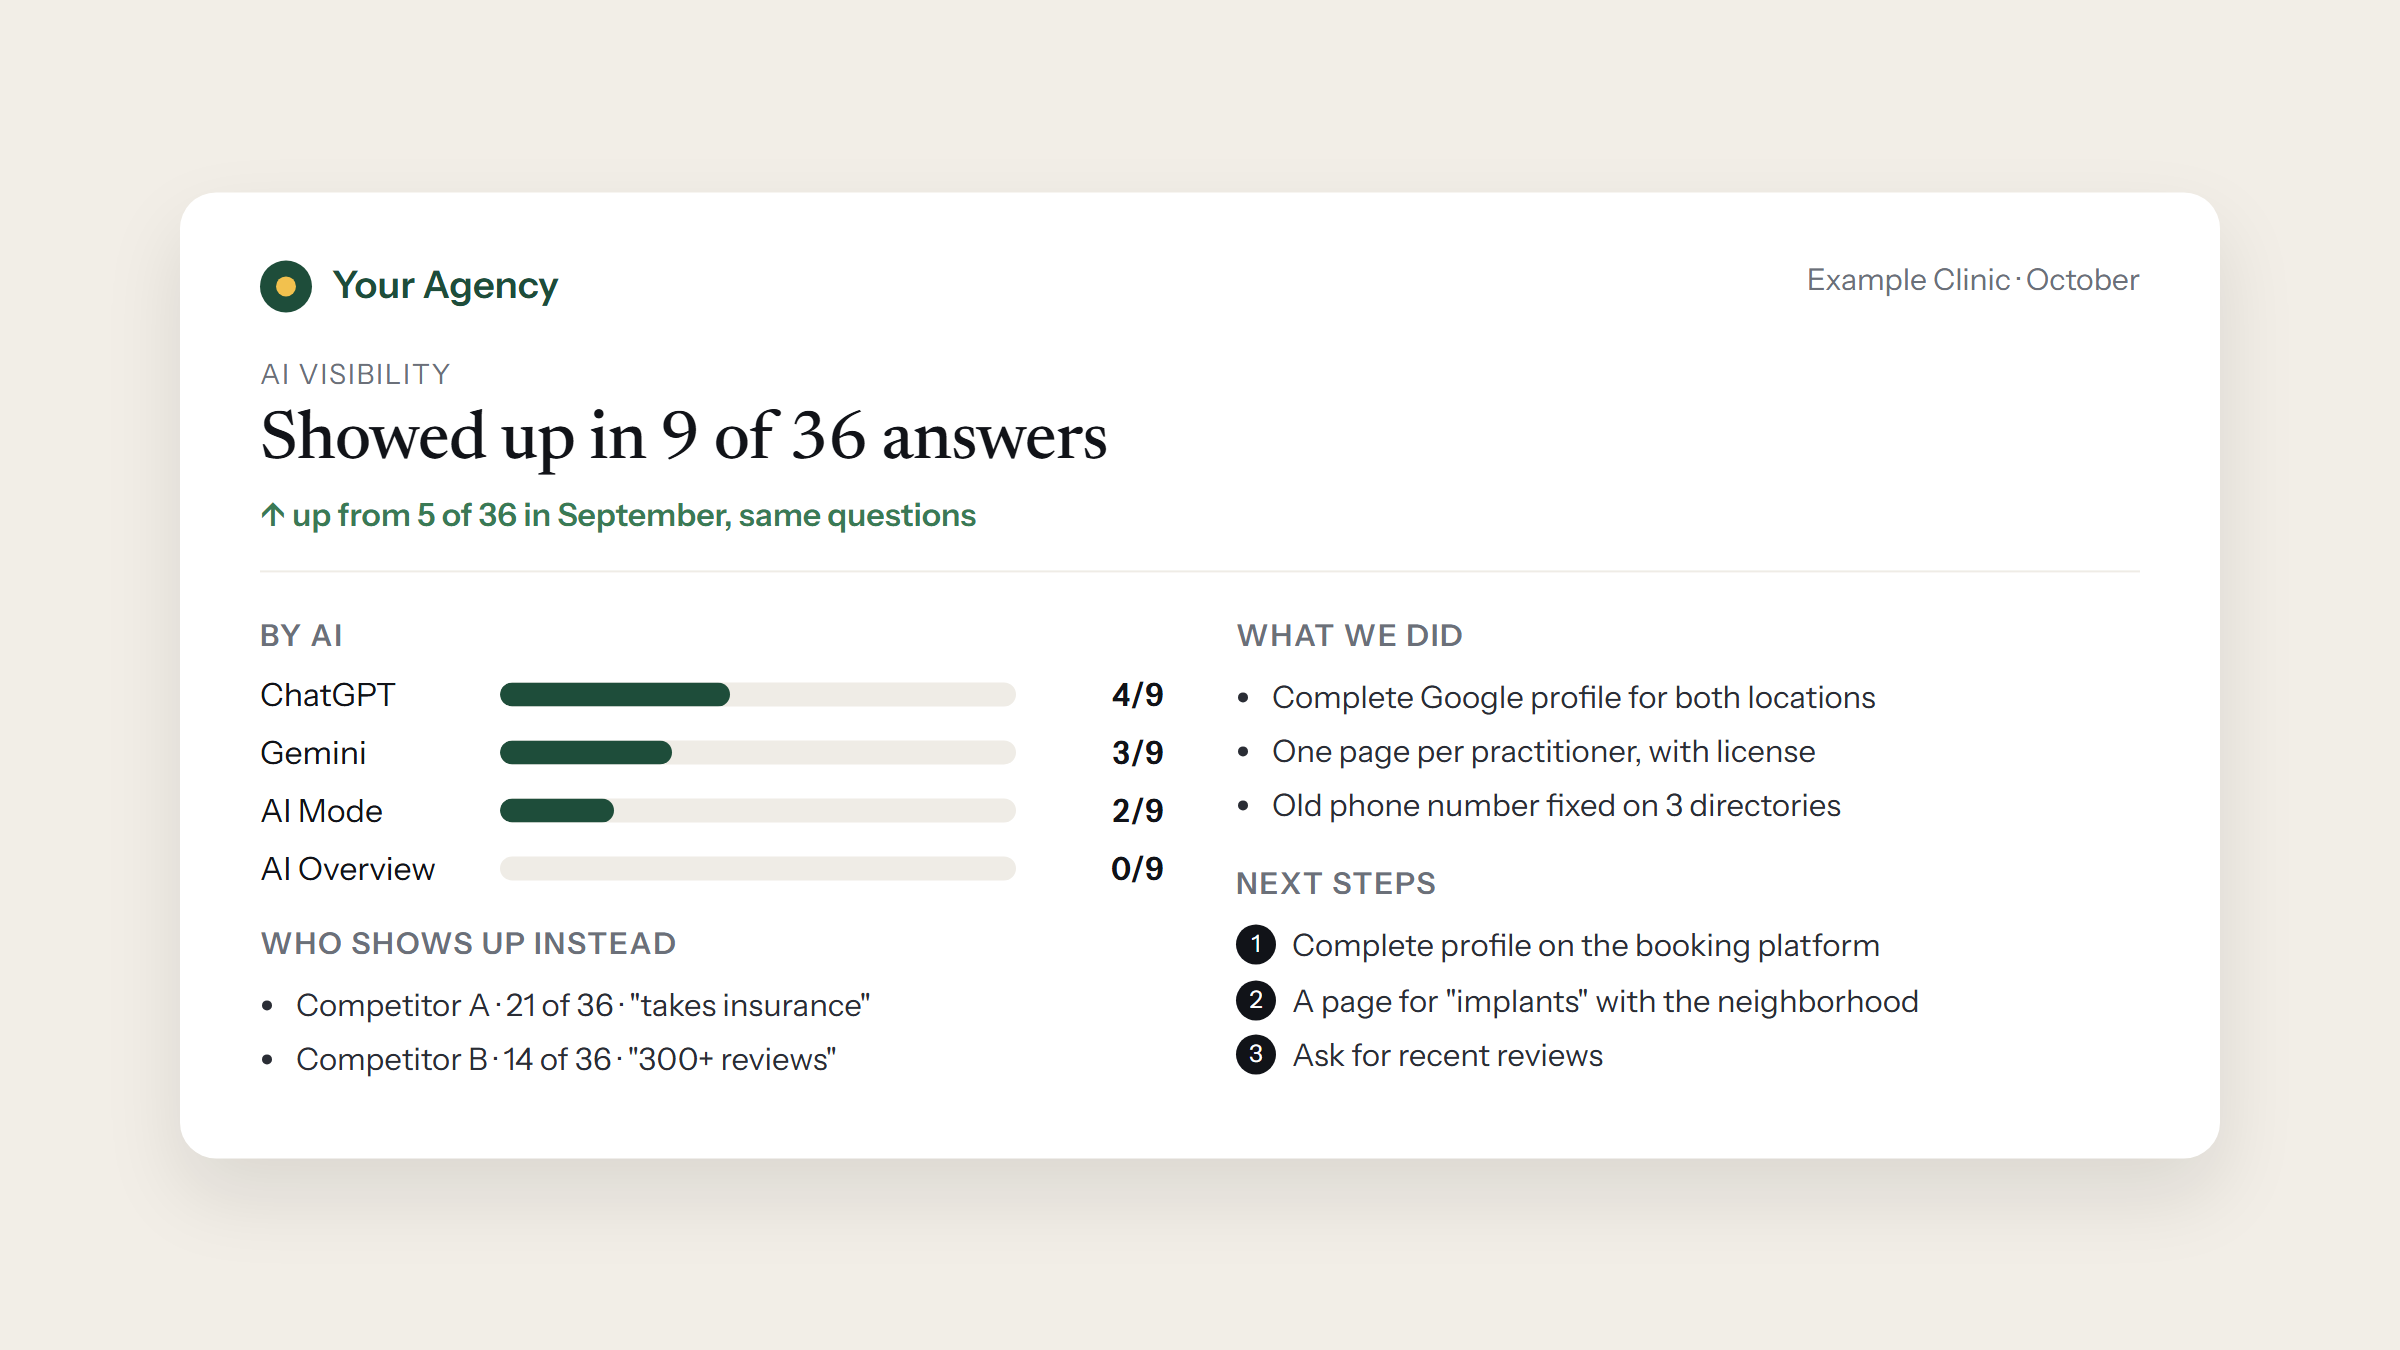
A one-page monthly report is usually enough:
- The headline: “Showed up in 9 of 36 answers this month, up from 5 of 36 last month.”
- By AI: one line for each, with the same “X of Y”.
- Who shows up instead: the three most frequent names and what the AI says about them.
- What we did: the month’s fixes (complete Google profile, one page per service, a profile on a platform in their field).
- What comes next: the next three fixes, in order.
Keep the same questions from one month to the next. If you change one, say so: that question’s comparison starts over.
How to explain the swings without losing the client
The question that will come: “why did we drop this month if we did everything?”. Two rules help:
- Only call it an improvement (or a drop) when it repeats. One good round can be luck. Two in a row in the same direction actually say something.
- Separate what came from the AI from what came from the work. AIs change models and formats without warning. A jump that shows up for every client at the same time most likely came from the AI, not the agency.
What never to promise
- A position or “the top spot”. Nobody controls what AI writes. Whoever promises it is selling something they don’t have, and the client finds out the first time they ask on their own.
- A deadline to show up. Fixes take time to reach the sources the AI reads, and each AI updates at its own pace.
- Results in healthcare, law and other regulated professions. Besides making no sense, the rules of those professional boards forbid promising results in the client’s communication.
What you can promise is method: agreed questions, repeated measurement, what changed and why, and a list of fixes the client understands.
With pleeku, this report comes ready: the score and the “X of Y” by AI, who shows up instead, the fixes and what changed since the previous round, with your agency’s logo, colors and footer, as a PDF, a link or a scheduled email.